What Happens Before main() Runs
Between the moment you type ./program and the execution of your main()‘s first instruction, more engineering happens than in most web applications during an entire request lifecycle. The kernel parses the ELF header, maps segments into memory, loads the dynamic linker, which resolves dozens of symbols, builds jump tables, and only then transfers control.
Most developers treat ./program as a black box. An engineer who understands ELF and dynamic linking knows why the first call to a library function is slower, how LD_PRELOAD lets you swap any function without recompilation, why ldd lies, and how symbol resolution can be an attack vector.
This article dissects the ELF format from the header through segments, the mechanics of ld.so, the GOT/PLT structures, lazy binding, and the practical applications of interposition. This is the knowledge that turns “linker errors” into a predictable, debuggable process.
Anatomy of an ELF File
ELF (Executable and Linkable Format) is the binary format used by practically all Unix systems for executables, shared libraries (.so), object files (.o), and core dumps. The structure has two complementary perspectives: the linking view (sections, for the linker) and the execution view (segments, for the loader).
# ELF header — the first 64 bytes determine everything
$ readelf -h ./program
ELF Header:
  Magic:   7f 45 4c 46 02 01 01 00 00 00 00 00 00 00 00 00
  Class:                             ELF64
  Data:                              2's complement, little endian
  Type:                              DYN (Position-Independent Executable file)
  Machine:                           Advanced Micro Devices X86-64
  Entry point address:               0x1060
  Start of program headers:          64 (bytes into file)
  Start of section headers:          14688 (bytes into file)
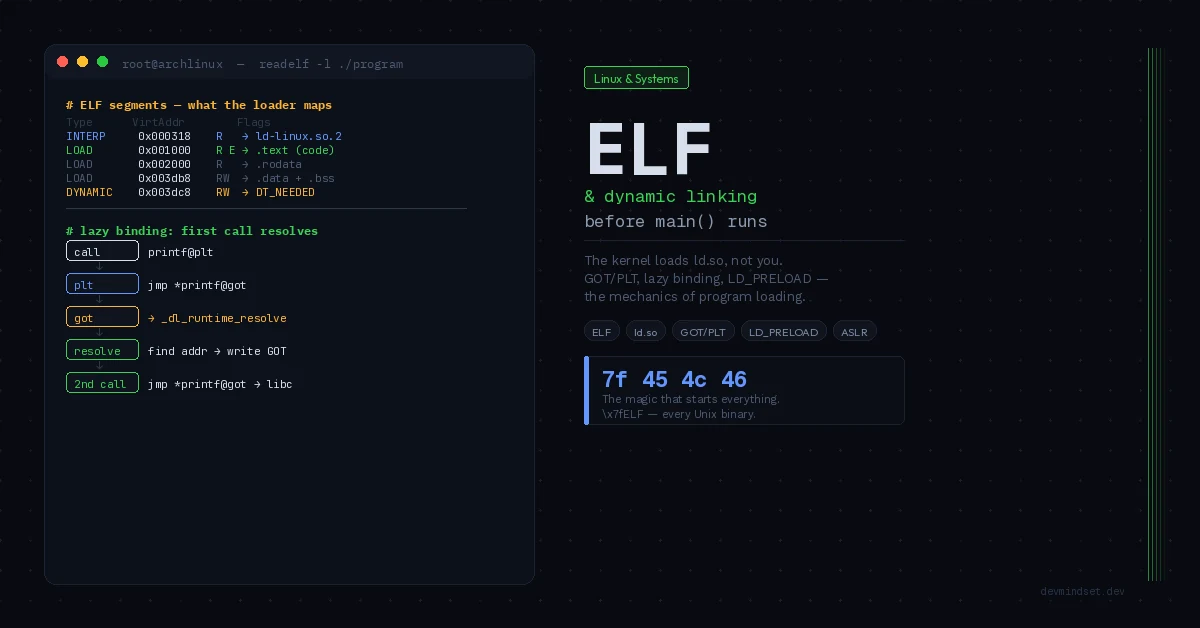
The magic number 7f 45 4c 46 (\x7fELF) identifies the file. The Type: DYN field indicates a PIE (Position-Independent Executable) — the default for years on modern distributions, crucial for ASLR (Address Space Layout Randomization). The Entry point is not main() — it’s _start, the runtime stub that will eventually call your main().
Sections vs Segments — Two Views of the Same File
| Aspect | Sections (linking view) | Segments (execution view) |
|---|---|---|
| Consumer | Linker (ld) | Loader (kernel + ld.so) |
| Granularity | Fine (.text, .data, .bss, .rodata) | Coarse (LOAD, DYNAMIC, INTERP) |
| Purpose | Relocation, symbol resolution | Mapping into memory with permissions |
| Table | Section Header Table | Program Header Table |
# Segments — what the loader actually maps into memory
$ readelf -l ./program

Program Headers:
  Type           Offset   VirtAddr           Flags  Align
  INTERP         0x000318 0x0000000000000318 R      0x1
      [Requesting program interpreter: /lib64/ld-linux-x86-64.so.2]
  LOAD           0x000000 0x0000000000000000 R      0x1000   # headers
  LOAD           0x001000 0x0000000000001000 R E    0x1000   # .text (code)
  LOAD           0x002000 0x0000000000002000 R      0x1000   # .rodata
  LOAD           0x002db8 0x0000000000003db8 RW     0x1000   # .data + .bss
  DYNAMIC        0x002dc8 0x0000000000003dc8 RW     0x8
The crucial one is the INTERP segment — it contains the path to the dynamic linker (/lib64/ld-linux-x86-64.so.2). The kernel reads this path, and it’s the linker, not the kernel, that finishes loading the program. Each LOAD segment has permission flags (R/W/E) mapped directly onto MMU page bits — the code segment is R E (read+execute, but not write), which blocks self-modifying code. Those same page flags decide whether a memory access is legal — the details are in the anatomy of a segfault.
The Role of the Dynamic Linker ld.so
When you run a dynamically linked program, the sequence is as follows:
- The kernel parses the ELF, maps the LOAD segments, reads the INTERP segment
- The kernel loads
ld.so(itself an ELF file) and transfers control to it — not to the program’s_start ld.soparses the.dynamicsection, finds the list of needed libraries (DT_NEEDED)- For each library: locate on disk, map, recursively resolve its dependencies
- Relocations and symbol resolution — filling the GOT
- Call constructors (
.init_array) - Jump to the program’s
_start, which finally callsmain()
# Trace the full library loading process via ld.so
$ LD_DEBUG=libs ./program 2>&1 | head -20
     find library=libc.so.6 [0]; searching
      search path=/lib/x86_64-linux-gnu/tls/haswell/x86_64
       trying file=/lib/x86_64-linux-gnu/libc.so.6
     calling init: /lib/x86_64-linux-gnu/libc.so.6

# All available ld.so debug categories
$ LD_DEBUG=help ./program
  libs        display library search paths
  reloc       display relocation processing
  symbols     display symbol table processing
  bindings    display information about symbol binding
  statistics  display relocation statistics
Why ldd Lies
The popular ldd is not a reliable inspection tool — it actually runs the program (setting LD_TRACE_LOADED_OBJECTS=1), which is dangerous for an untrusted binary. Moreover, ldd‘s output may differ from the actual runtime resolution, because it doesn’t account for dlopen(), LD_PRELOAD, or dynamically set RPATH. The safe alternative:
# Safe dependency inspection — without running the binary
$ objdump -p ./program | grep NEEDED
  NEEDED               libssl.so.3
  NEEDED               libcrypto.so.3
  NEEDED               libc.so.6

# Alternatively via readelf
$ readelf -d ./program | grep NEEDED
 0x0000000000000001 (NEEDED)  Shared library: [libssl.so.3]
 0x0000000000000001 (NEEDED)  Shared library: [libc.so.6]
GOT and PLT — The Mechanics of External Function Calls
Here’s the core. Since libraries are loaded at random addresses (ASLR), how can code call printf() when its address isn’t known at compile time? The answer is two structures: the GOT (Global Offset Table) and the PLT (Procedure Linkage Table).
- GOT — a table of pointers. An entry for each external symbol, filled by
ld.sowith the actual runtime address. A data section, writable. - PLT — a table of small code stubs. Each external function has its PLT entry, which performs an indirect jump through the GOT.
A printf() call in your code actually compiles to call printf@plt — a jump to the PLT stub, not the function itself:
/* Your code */
printf("hello\n");

/* Compiles to (simplified): */
call printf@plt        /* jump to the PLT stub */

/* printf@plt (simplified assembly): */
printf@plt:
    jmp *printf@got     /* indirect jump through the GOT */
    /* if GOT not filled — fallback to the resolver */
    push $printf_index
    jmp _dl_runtime_resolve
Lazy Binding — Why the First Call Is Slower
By default ld.so uses lazy binding: function addresses are resolved only on the first call, not during loading. This is a startup optimization — a program loading hundreds of functions but using ten of them doesn’t pay to resolve the rest.
The mechanics: initially the GOT entry for a function points back to the PLT code, which calls _dl_runtime_resolve. This locates the function’s actual address, writes it into the GOT, and jumps to the function. Every subsequent call goes directly through the filled GOT — hence the overhead only the first time.
# Force eager binding — all symbols resolved at startup
$ LD_BIND_NOW=1 ./program
# Slower start, but no overhead on the first call of each function
# Also: the entire GOT can be read-only (RELRO) — security hardening

# Check if a binary has Full RELRO (GOT read-only after startup)
$ readelf -l ./program | grep GNU_RELRO
  GNU_RELRO  0x002db8 0x0000000000003db8 R   0x1
$ readelf -d ./program | grep BIND_NOW
 0x000000000000001e (FLAGS)  BIND_NOW   # Full RELRO active
The security/performance trade-off: lazy binding requires a writable GOT for the entire process lifetime — the GOT overwrite attack vector. Full RELRO (LD_BIND_NOW + -z relro) resolves everything at startup and makes the GOT read-only, eliminating this vector at the cost of slower startup.
LD_PRELOAD — Interposition as a Superpower
LD_PRELOAD instructs ld.so to load the specified library before all others. Since symbol resolution searches libraries in load order, a function defined in the preloaded library shadows the same function from libc. This lets you swap any library function without recompiling the program.
/* malloc_tracker.c — intercepting every allocation */
#define _GNU_SOURCE
#include <dlfcn.h>
#include <stdio.h>
#include <stdlib.h>

/* Pointer to the original malloc from libc */
static void *(*real_malloc)(size_t) = NULL;

void *malloc(size_t size) {
    if (!real_malloc) {
        /* Fetch the original symbol from the next library in the chain */
        real_malloc = dlsym(RTLD_NEXT, "malloc");
    }

    void *ptr = real_malloc(size);

    /* Instrumentation — log to stderr to not disturb the program's stdout */
    fprintf(stderr, "[malloc] %zu bytes → %p\n", size, ptr);

    return ptr;
}
# Compile as a shared library
$ gcc -shared -fPIC -o malloc_tracker.so malloc_tracker.c -ldl
# Inject into any program — without recompiling it
$ LD_PRELOAD=./malloc_tracker.so ls
[malloc] 5 bytes → 0x55a3c2b04260
[malloc] 120 bytes → 0x55a3c2b042a0
[malloc] 1024 bytes → 0x55a3c2b04320
...This isn’t a hack — it’s the foundation of many professional tools. AddressSanitizer, jemalloc and tcmalloc as drop-in allocators, test mocking libraries, profiling tools — all use this mechanism. RTLD_NEXT in dlsym is the key: it fetches the next symbol in the chain, letting the wrapper call the original.
Static vs Dynamic Linking — The Trade-off
| Dimension | Static (-static) | Dynamic (default) |
|---|---|---|
| Binary size | Large (entire libc compiled in) | Small (own code only) |
| RAM usage (N processes) | N × full copy | 1 × shared library |
| Startup time | Fast (no resolution) | Slower (ld.so + relocations) |
| Library updates | Requires recompilation | Swapping the .so suffices |
| Security patches | Rebuild every binary | One libc update |
| Portability | Full (zero dependencies) | Dependent on .so versions |
| Use case | Scratch containers, static CLIs | Standard system deployment |
The renaissance of static linking is visible in Go (static by default) and Rust (musl target) — mainly for scratch containers (zero-dependency images) and single-binary distribution. Dynamic remains the system standard due to memory sharing and central security patches (one CVE in OpenSSL = one libssl.so update, not a rebuild of a thousand applications). That sharing of code pages between processes rests on copy-on-write — the same mechanism as the fork() system call.
Practical Diagnostics — Tools
| Tool | Use |
|---|---|
readelf -h/-l/-d | Inspect header, segments, dynamic section |
objdump -d/-p | Disassembler + program headers (safe for dependencies) |
nm -D | Dynamic symbols exported/imported by a .so |
LD_DEBUG=all | Full trace of loading and resolution at runtime |
LD_TRACE_LOADED_OBJECTS=1 | Dependency list (what ldd does, but deliberately) |
patchelf | Modify RPATH, interpreter, SONAME of an existing binary |
strace -e trace=openat | Which .so files are actually opened at startup |
Conclusion: The Linker as Part of the Execution Contract
Dynamic linking isn’t magic that “just works” — it’s a precisely defined protocol between the compiler, linker, kernel, and ld.so. Understanding the ELF format, GOT/PLT mechanics, and lazy binding turns a whole class of problems (symbol not found, version mismatch, wrong library loaded, slow startup) from mysterious into deterministic and debuggable.
An engineer who knows that ./program first runs ld.so, that the first library function call goes through the resolver, that LD_PRELOAD lets you inject arbitrary instrumentation — holds tools most developers don’t know exist. That’s the difference between “linker error, I’ll check Stack Overflow” and “missing DT_NEEDED for libssl.so.3, I’ll add the path to RPATH via patchelf.”
The mechanics of loading a program are the foundation everything else stands on. It’s worth knowing what happens before main() runs.
Related articles
- Anatomy of a Segfault — From MMU Through Kernel to gdb Core Dump — segment mapping and page permissions
- malloc internals — Why free() Doesn’t Return Memory to the System — LD_PRELOAD as the allocator swap mechanism
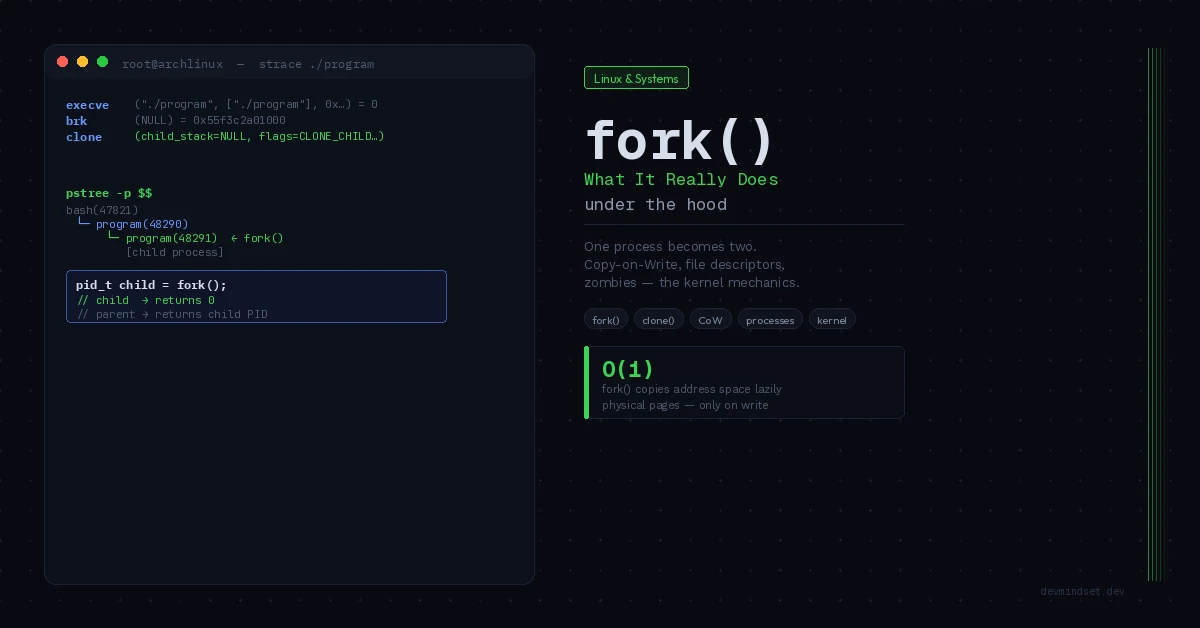
- What fork() in Linux Really Does Under the Hood — sharing libraries via copy-on-write
- strace as a Debugging Primitive — When the Stack Trace Lies — LD_DEBUG and strace as loading-analysis tools