Before you optimize: measure, don’t guess
Optimizing Python code without profiling is shooting in the dark — intuition often points to the wrong places. Before you touch refactoring, run cProfile and see which functions actually dominate execution time.
# Run these commands in the terminal:
python -m cProfile -o output.prof my_script.py
python -c "import pstats; pstats.Stats('output.prof').sort_stats('cumulative').print_stats(10)"
cProfile is Python’s built-in function profiler that measures call statistics — execution time of each function and number of calls. It gives an overview, but won’t show which lines inside functions are slow.
When cProfile, when line_profiler?
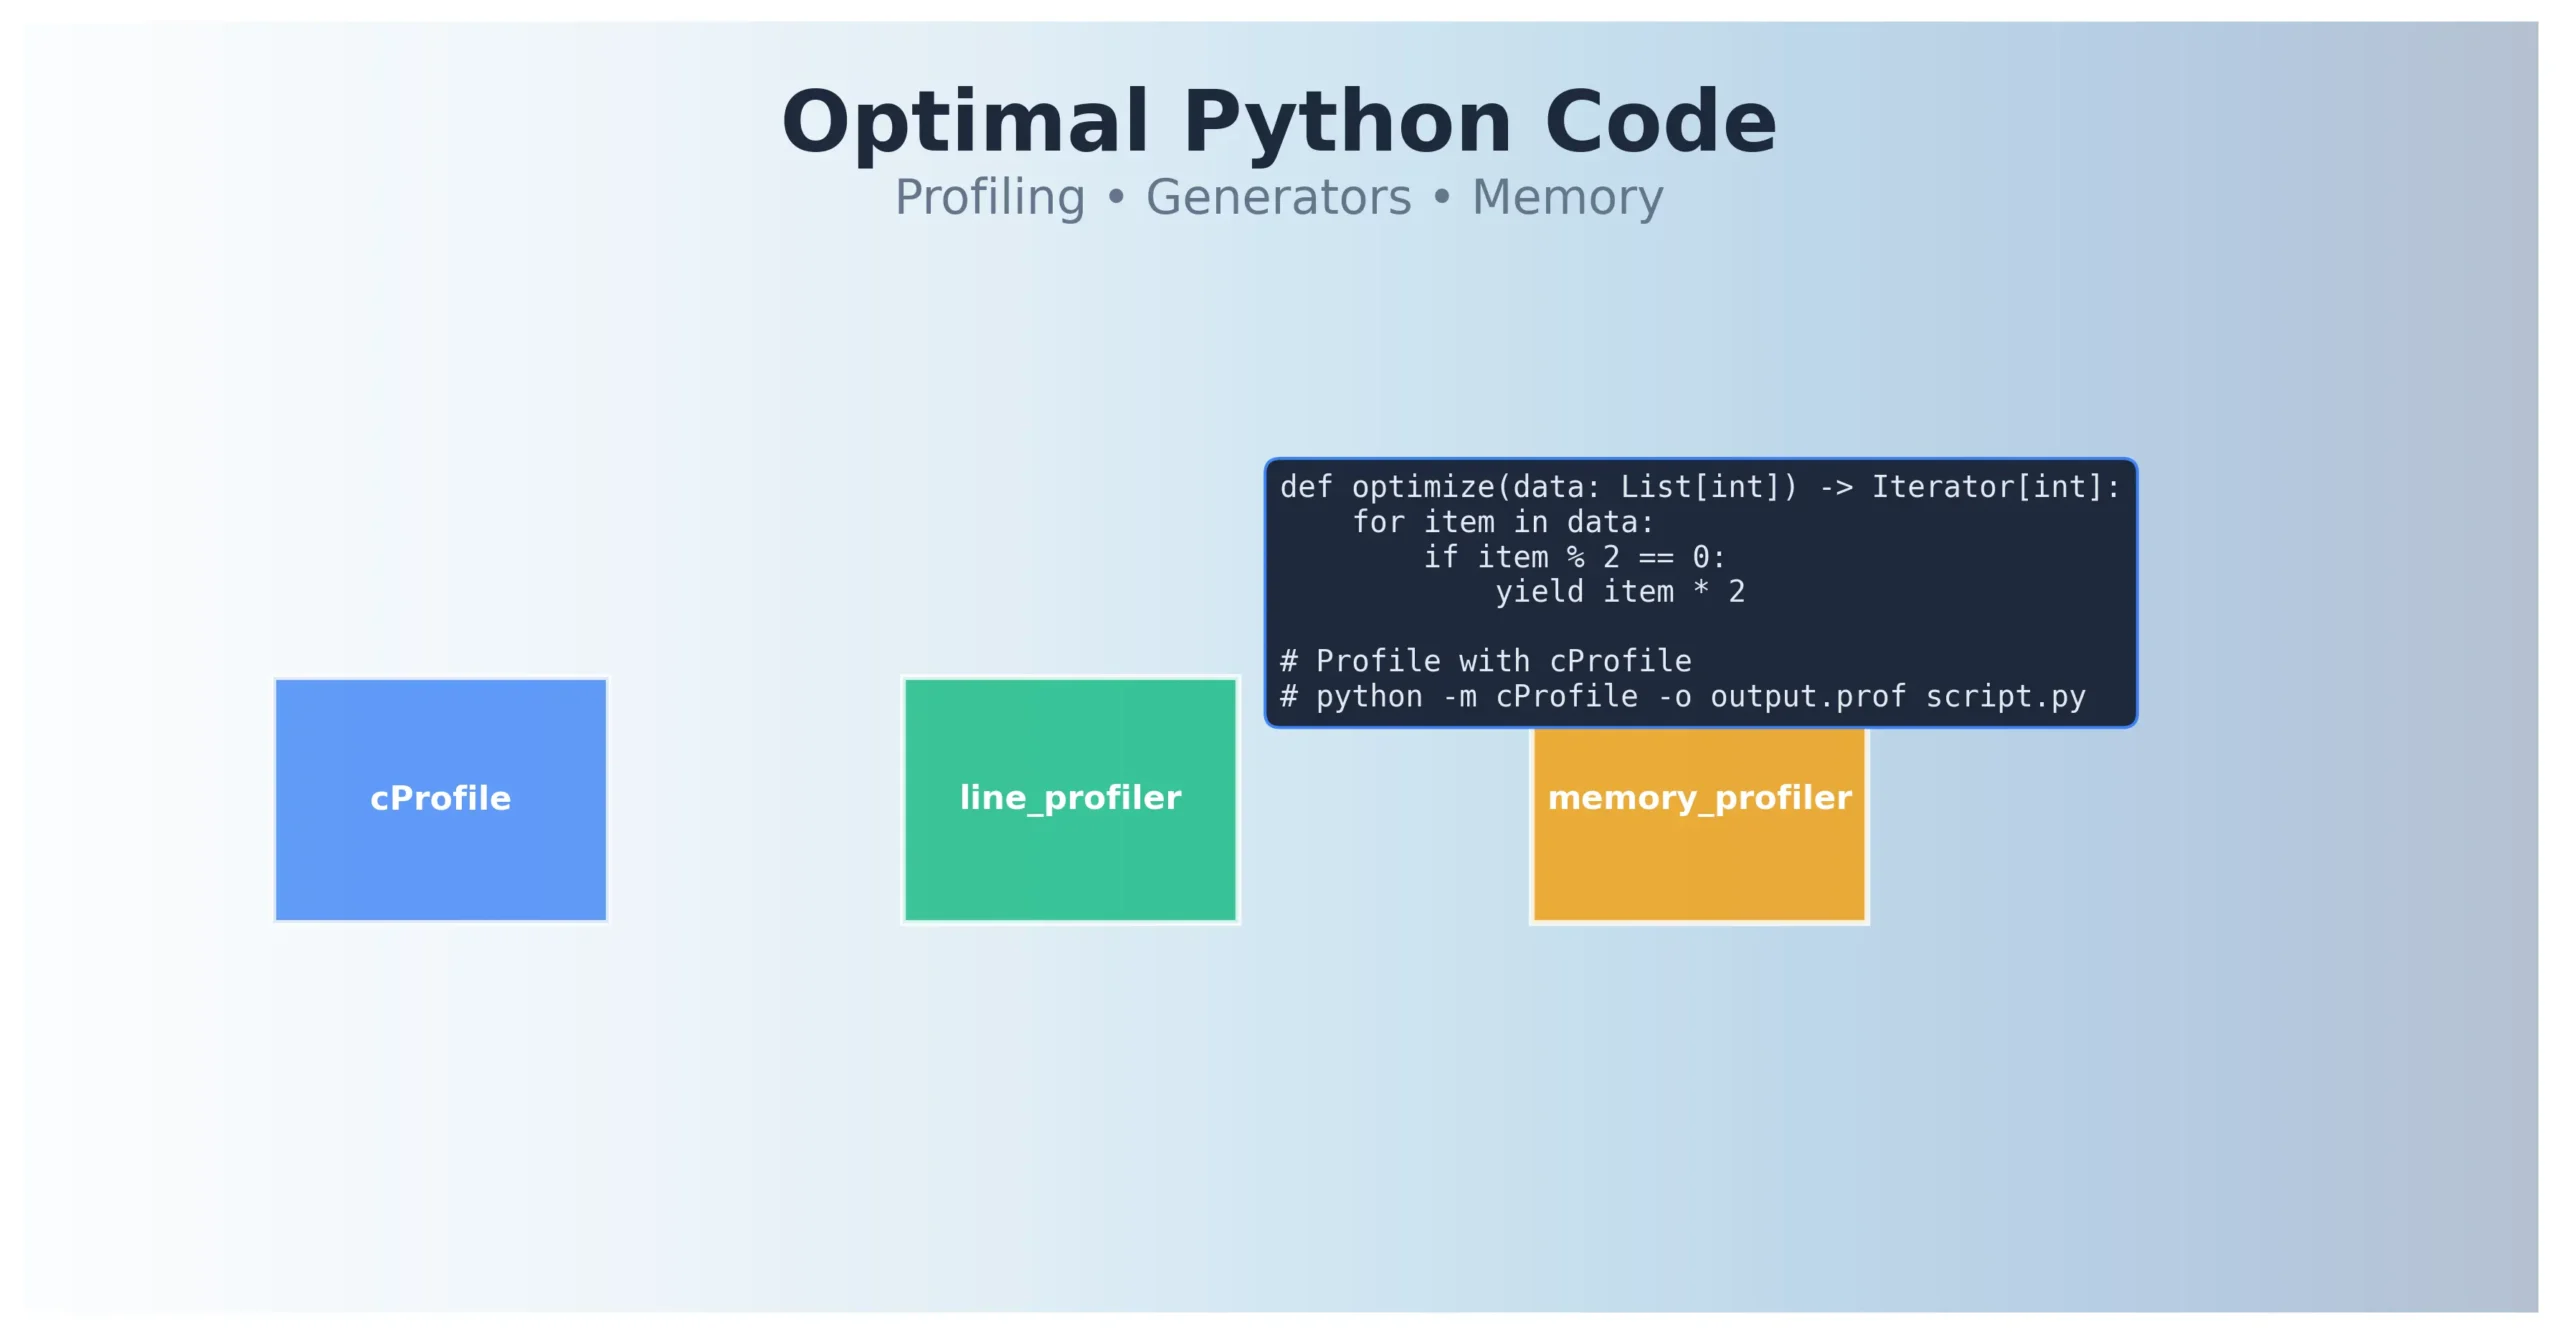
cProfile shows time spent in functions and their calls. Start with the functions that account for the largest share of the whole run. Use line_profiler when you need to locate expensive lines inside one of them.
# Install line_profiler:
# pip install line_profiler

# Decorate function for line-by-line profiling:
@profile
def process_data(items):
    result = []
    for item in items:
        if item % 2 == 0:
            result.append(item * 2)
    return result

if __name__ == "__main__":
    process_data(range(100_000))

# Run with kernprof:
# kernprof -l -v my_script.py
The workflow is simple: cProfile gives the big picture, line_profiler shows details inside slow functions, then you optimize only what actually hurts.
This is the same principle as hypothesis-driven debugging: establish where the time goes before changing the code.
Generators and itertools — memory efficiency in practice
A list holds all results at once. A generator can produce them one at a time, so a simple streaming pipeline does not need memory for the whole collection. The saving depends on what the generator retains internally and whether its consumer collects the results into a list again.
| Feature | List | Generator |
|---|---|---|
| Memory usage | O(n) — everything in memory | Depends on retained state; O(1) in this example |
| Access | Random (indexing) | Sequential (iteration) |
| Multiple iterations | Yes, unlimited | No, generator exhausts |
| len() | Available | Not available |
# List — retains all results:
def process_with_list(n):
    result = []
    for i in range(n):
        result.append(i * 2)
    return result

# Generator — computes results on demand:
def process_with_generator(n):
    for i in range(n):
        yield i * 2

# Usage:
for value in process_with_generator(10_000_000):
    process(value)  # Stream processing
Generator expressions are list comprehensions syntax with parentheses instead of brackets. They’re lazy — they don’t build a list in memory. Use them when you process data once, top to bottom, and memory matters.
# List comprehension — builds a list:
squares_list = [x**2 for x in range(1000000)]

# Generator expression — uses O(1) memory:
squares_gen = (x**2 for x in range(1000000))

# itertools — all functions return iterators, never lists:
from itertools import islice, chain, count

# Infinite iterator, safe because islice cuts it:
for x in islice(count(), 100):
    process(x)

# Combining iterators without building a list:
all_data = chain(iterator1, iterator2, iterator3)
itertools provides tools for composing iterators. They do not all use constant memory or accept infinite inputs: product() collects its input pools first, while tee() buffers elements when consumers advance at different speeds. islice(count(), 100) terminates because it explicitly limits the number of items consumed.
Here, process(), data and the input iterators stand for parts of your application. Creating a generator does not execute its workload: a meaningful measurement must include consuming its results.
Common performance pitfalls
String concatenation in a loop
Repeatedly concatenating immutable strings can copy a growing result and lead to quadratic cost. CPython optimizes some += cases, so that cost is not a guarantee for every run. When joining many fragments, "".join() expresses the intent clearly; measure it on your data.
# Repeated concatenation may copy the growing result:
def concat_bad(items):
    result = ""
    for item in items:
        result += str(item)
    return result

# Join the prepared fragments:
def concat_good(items):
    return "".join(str(item) for item in items)
List comprehension vs map/filter
In Python 3, map() and filter() return iterators. For a simple condition and transformation, a list comprehension can be easier to read than nested lambdas. Choose a clear expression, then measure any performance difference.
# List comprehension — readable and fast:
even_doubled = [x*2 for x in data if x % 2 == 0]

# Avoid — lambda in map/filter is less readable:
even_doubled = list(map(lambda x: x*2, filter(lambda x: x % 2 == 0, data)))

# Acceptable — when function already exists:
even_doubled = list(map(double, filter(is_even, data)))
Tools beyond profiling: code quality
Optimal code isn’t just fast code — it’s also readable, maintainable, and free of type errors. PEP 8 is the official Python style guide. Black auto-formats code without debate. Ruff is a fast linter replacing slower tools. mypy statically checks types.
| Tool | Task | When to use |
|---|---|---|
| Black | Auto-formatting code | Before every commit, in CI |
| Ruff | Fast linter (replaces flake8, isort) | In pre-commit hooks, CI |
| mypy | Static type checking | When code uses type hints |
| cProfile | Function profiling | First optimization step |
| line_profiler | Line-by-line profiling | For micro-optimizations |
# Type hints + mypy:
from typing import List, Iterator

def process_items(items: List[int]) -> Iterator[int]:
    for item in items:
        if item % 2 == 0:
            yield item * 2

# Run mypy:
# mypy my_module.py
When (and when not) to optimize
The rule is simple: first make the code work, then make it readable, then make it fast — but only where profiling shows a problem. Optimization without data is a waste of time.
Consider total cost, call count and the purpose of the measurement. A function consuming most of the task’s runtime usually offers more room for improvement than a rarely used fragment. For a service, individual request latency matters too: an average can hide a problem.
Alternatives to cProfile and line_profiler
py-spy is a sampling profiler that can observe a running Python process. It needs appropriate permissions, and its overhead should still be assessed. For memory allocations, Python includes tracemalloc. memory_profiler provides line-by-line measurements, but its repository states that it is no longer actively maintained.
Line-by-line use of memory_profiler requires decorating selected functions with @profile and actually calling them during the run. Use profiler output to locate costs; also compare before-and-after timings without the profiler.
# py-spy — profile process in production:
py-spy top --pid 12345

# memory_profiler — memory line-by-line:
# pip install memory_profiler
# Run: python -m memory_profiler my_script.py
Checking Whether the Change Helped
Find the functions that dominate runtime, inspect expensive lines where needed, and consider whether the data structure suits the workload. If memory is the problem, examine allocations separately, for example with tracemalloc.
Repeat the measurement on the same data and verify the program’s output. You do not need to run every profiler in a fixed sequence; choose the tool that answers your question.
Where to Go Next
If RSS stays high after objects are released, read about malloc and free(), keeping in mind that Python also has its own memory-management mechanisms. If you suspect waits inside the OS, strace can expose system calls. cProfile alone does not provide a complete syscall trace.
Technical references: Python profilers, itertools, memory_profiler project status.