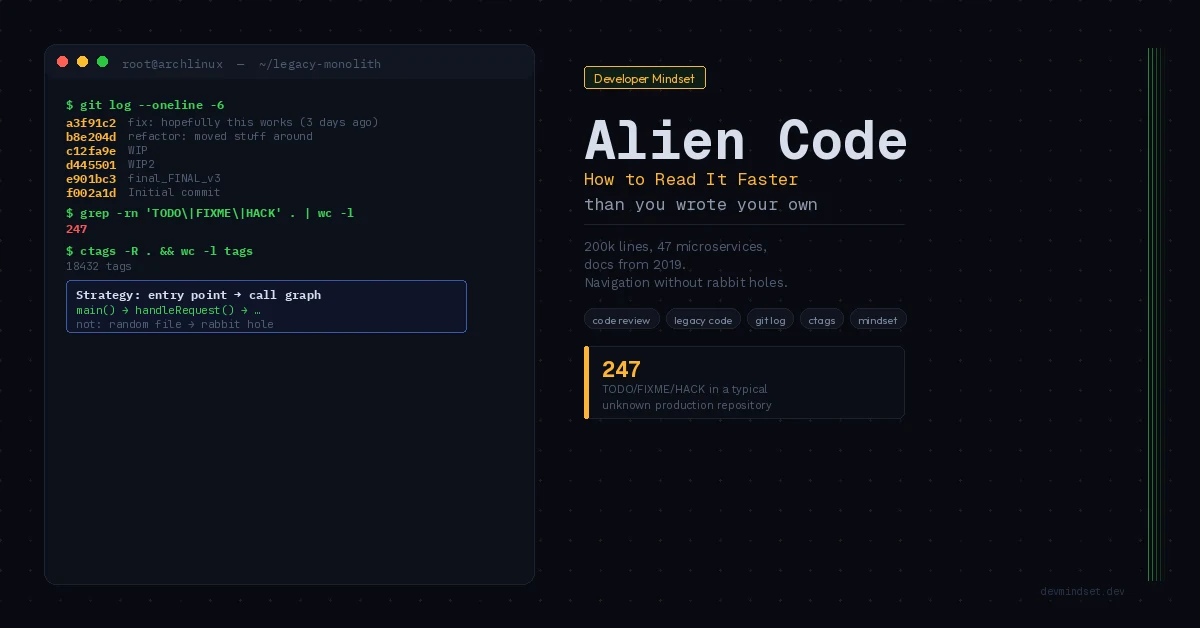
You get a repository with 200,000 lines, 47 microservices, and documentation from 2019. You open the IDE, click a random file, scroll, close it. You open another. An hour later you still don’t know what the code does — you only know you don’t want to touch it.
Random file browsing produces details with little context. Instead of reading the whole project in sequence, choose one path from a system input to the result a user sees.
The myth of “good code that documents itself”
“Good code is self-documenting” is a useful aim, until variable names are expected to replace the history of design decisions.
No non-trivial system documents itself. A variable name tells you what the variable holds. It doesn’t tell you why that variable exists in the first place, who modifies it, when its value makes sense, or what business problem forced its existence. That context lives outside the code — in decisions, constraints, and the team’s history.
Developers who believe the self-documenting code myth read someone else’s project like a novel: line by line, file by file, top to bottom. An hour in, they have a thousand details in their head and zero understanding of the system. That’s the exact opposite of the direction you should be going.
Reading other people’s code starts at entry points, not at the file that caught your eye
Entry points show what starts a piece of code. They do not provide all the context, but are a useful starting point for tracing one request or task.
Typical entry points by project type:
- Web backend: route/endpoint definitions — these accept requests from the outside world
- CLI: the
main()function or its equivalent in your language - Worker/scheduler: definitions of cron jobs or queue consumers
- Frontend: the root component (App.jsx, main.ts) and routing
- Library: the public API in
index.*or the package manifest
You open the entry point and ask one question: “What does this system do from the outside?” Not how it does it. What. Only when you have that answer have you earned the right to go deeper.
Map the system before you understand a function
Before getting stuck in a function’s details, check who calls it and with what data. Its conditions and exceptions make more sense once you know its role in the larger flow.
You open processOrder(). 200 lines, 12 variables, 4 nested ifs. You start reading from the top. Five minutes in you’ve lost the thread. You go back to the beginning. Fifteen minutes in you still don’t know what the function does.
Do the opposite instead. Close the file and find every place that calls processOrder(). Each callsite is a specification — it shows what inputs the function is called with, what system state it expects, and why. Three callsites will give you more context than reading the function body for an hour.
This is a top-down approach, from context to detail. Once you understand the flow, return to the implementation and check whether it behaves as callers assume.
Text Search and Symbol Navigation: grep, rg, LSP
Most developers navigate code exclusively through IDE clicks. That’s like reading a library by turning every page in sequence. It works, but it’s needlessly slow.
grep — your first reflex
Before you open anything, check whether the term you’re hunting for even exists and how often it appears:
# Number of lines containing "processOrder" in each JS file
grep -r "processOrder" . --include="*.js" -c

# All function definitions containing "Order"
grep -rn "function.*Order\|def.*Order" .

# Files that import a given module
grep -rln "from.*OrderService" .
Useful flags include -n for line numbers, -l for filenames, -c for matching-line counts per file and GNU grep’s --include for filename filtering. Text search can also match comments and unrelated symbols with the same name.
ripgrep (rg) — grep for modern projects
ripgrep respects ignore rules, including .gitignore, and skips hidden and binary files by default. Directories such as node_modules are skipped when ignore rules cover them, not because of their names.
rg "processOrder" --type js
rg -A 5 "class OrderService"  # 5 lines of context after each match
LSP in your IDE — when you need semantics
“Find References,” “Go to Definition” and “Find Implementations” use language analysis to distinguish symbols with identical names. Results depend on project configuration and language-server capabilities. Dynamic calls, generated code or reflection may need runtime inspection.
Use text search for broad reconnaissance and semantic navigation for a particular symbol. Choose the order according to the question and the project’s index state.
Git as a reading tool, not just a commit tool
Someone else’s code isn’t just the current state of files. It’s also a history of decisions visible through git log and git blame.
When you see a strange line of code that “looks like a bug” — before reporting or fixing it, check why it’s there:
# Who wrote this line and when
git blame -L 45,55 path/to/file.js

# History of a specific function (tracks changes)
git log -L :processOrder:path/to/file.js

# All commits touching the file, with full diff
git log --follow -p path/to/file.js
A strange line may fix an earlier bug. The commit message, linked issue and regression test help establish why it exists. git blame identifies the last change to a line, not the full decision history.
When to stop reading and start running
Static code reading has a ceiling. Past a certain complexity, no mind can hold every state the code might reach. At that point reading stops being productive.
The solution: run the code. But not just anyhow.
- Set a breakpoint at the entry point and step through a real request with a debugger
- Add temporary logs at 3-4 strategic points to see the order of calls
- Run the existing tests with the verbose flag — they’ll show you how the code behaves in different scenarios
- If the code uses a database, inspect generated queries in query or ORM logs.
EXPLAIN ANALYZEexamines the execution of a selected query and actually runs it; use it deliberately in an appropriate environment.
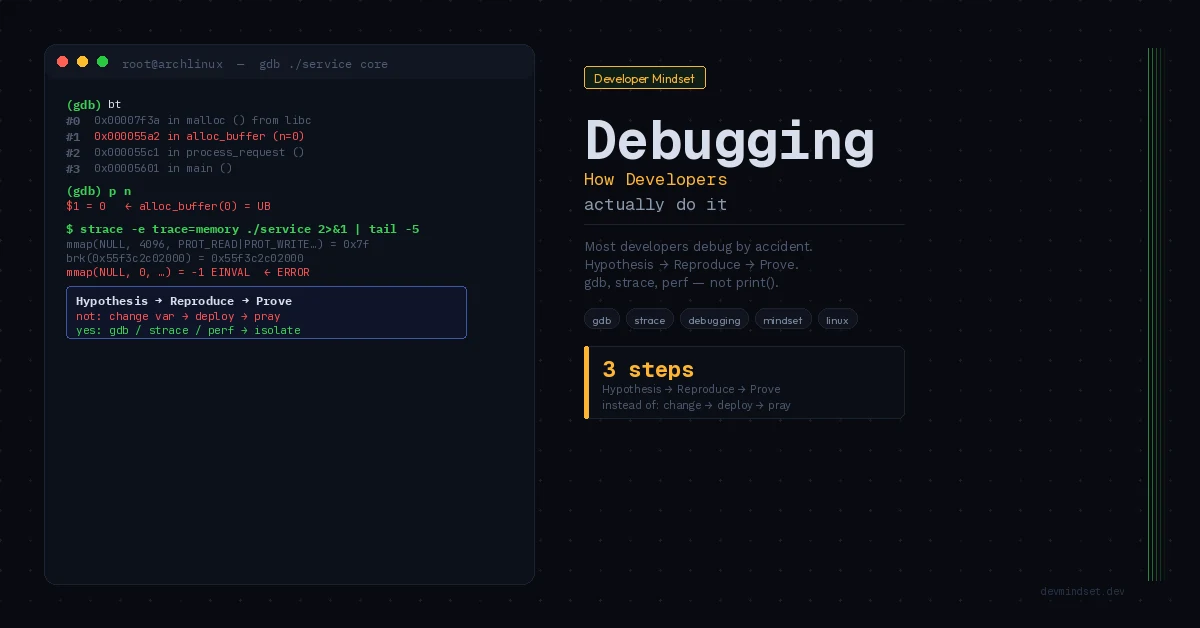
Five minutes with a running debugger will give you more understanding than an hour of staring at files. I covered the same approach in the article on debugging like a developer — a debugger is a tool for deduction, not just a tool for catching errors.
You might inherit a project written in a style you hate: global variables, 500-line functions, names transliterated from another language. None of that changes the process. Entry points, callsites, tools, git history, running the code — it works regardless of the quality of code you’re reading.
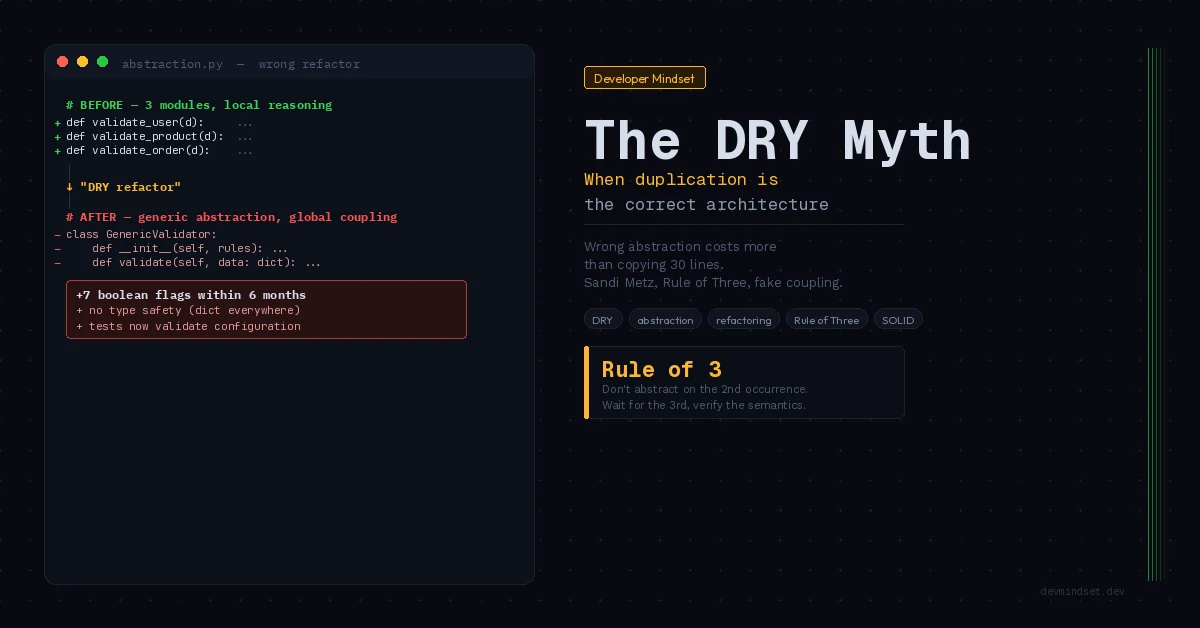
Also inspect whether shared modules group the same knowledge or merely similar lines. The article on DRY and premature abstraction explains the distinction and helps decide which dependencies to understand before a change.
In fact, reading code whose style annoys you is the best training for this skill. It’s easy to read code that looks like your own. Professionalism starts where the code is ugly and you have to understand it anyway.
What to do differently starting today
Next time you get a new project — or revisit your own from two years ago — before opening a single file, do three things:
- Open the README and the package manifest. Identify the project type and its entry points.
- Find the entry points physically in the code. Read only them — not the functions they call.
- Pick one execution path (e.g. a single endpoint) and trace it top-down, using grep and LSP as your map.
Reading other people’s code is a skill without a ceiling. The more code you read in this structure, the faster you recognize architectural patterns — and the less time you need for every next project. It’s one of the few skills in programming where experience actually compounds.
Technical reference: ripgrep file filtering.