Why Your Shell Startup Takes 800 Milliseconds
You open a terminal tab and wait for the prompt. Your .bashrc starts nvm, pyenv, kubectl completion and Git integration, even when you only wanted to inspect one file. Before changing shells, measure which component takes the time.
We will examine Bash startup files, measurement and deferring initialization until a tool is used. The goal is a quicker start based on evidence. No particular millisecond result can be promised for every set of dotfiles.
Shell Classification — Without This, Nothing Else Makes Sense
Bash distinguishes two orthogonal axes, whose combination determines which configuration file gets loaded:
- Login vs non-login shell — login means an initiating session (TTY login,
ssh,su -); non-login is a subshell spawned inside an existing session (new tab in GNOME Terminal under default config). - Interactive vs non-interactive — Bash without a script or
-cis normally interactive when stdin and stderr are terminals.-ican force interactive mode; scripts are non-interactive by default.
The combination produces four startup classes, each with a different loading chain — the exact precedence is specified in the GNU Bash manual’s startup files reference:
| Shell type | Loaded files (in order) |
|---|---|
| Login + Interactive (ssh, TTY) | /etc/profile → ~/.bash_profile (or ~/.bash_login, or ~/.profile) |
| Non-login + Interactive (new tab) | ~/.bashrc; system bashrc depends on distribution and configuration |
| Non-interactive (script) | Read and execute the file named by BASH_ENV, if set |
Login + Non-interactive (cron with bash -l) | /etc/profile → first readable of ~/.bash_profile, ~/.bash_login, ~/.profile; then the file named by BASH_ENV |
Most people treat ~/.bashrc and ~/.bash_profile as synonyms — wrong. The classical pattern is sourcing .bashrc from .bash_profile so that login shells also pick up the configuration:
The table covers ordinary bash invocation. sh mode, startup options and detection of remote execution through sshd can alter these rules. Not every ssh host command starts a login shell.
# ~/.bash_profile
[[ -f ~/.bashrc ]] && source ~/.bashrc
Measuring Shell Startup Time — No Guessing
First step before optimization: measurement. Without a baseline, optimization is religion, not engineering.
# Baseline: ten separate interactive shell startup times
$ for i in {1..10}; do time bash -i -c exit; done 2>&1 |
    grep real | awk '{print $2}'

# Example output:
# 0m0.847s
# 0m0.832s
# 0m0.851s
# 0m0.839s
# ...
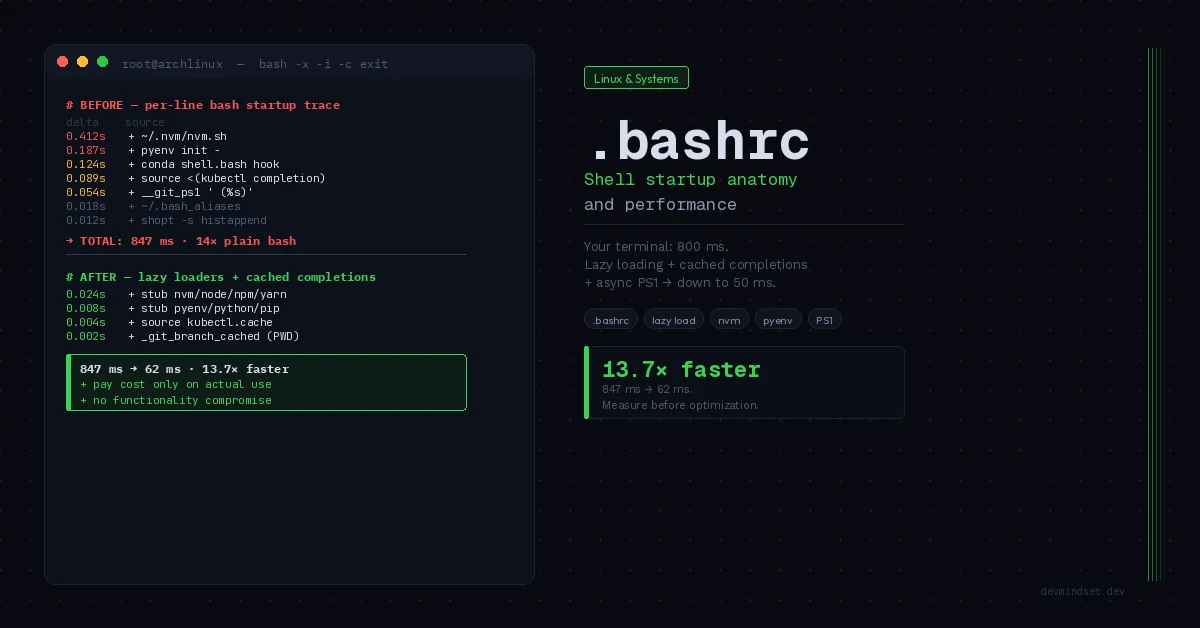
This number is our reference truth. Now we locate the bottleneck via per-line tracing with timestamps:
# Bash 5+: set PS4 inside the shell, before loading ~/.bashrc.
trace_rc=$(mktemp)
cat > "$trace_rc" <<'BASHRC'
PS4='+ ${EPOCHREALTIME} '
set -x
source "$HOME/.bashrc"
BASHRC
bash --noprofile --rcfile "$trace_rc" -i -c exit 2> /tmp/bash-trace.log
rm -f -- "$trace_rc"

# Attribute elapsed time to the previous trace line, not the next.
LC_ALL=C awk '
  /^\++ [0-9]+\.[0-9]+ / {
    if (seen) {
      delta = $2 - prev
      if (delta > 0.010) printf "%.3fs  %s\n", delta, line
    }
    prev = $2; line = $0; seen = 1
  }
' /tmp/bash-trace.log | sort -rn | head -20
This trace covers your ~/.bashrc, not the whole shell startup or system bashrc. It suggests candidates to investigate, but adds overhead itself, and nested calls complicate attribution. Disable the suspected fragment and repeat without tracing to confirm.
The Worst Offenders — Patterns That Steal Seconds
Inspect version-manager initialization, generated completions and prompt functions first. Cost depends on tool versions, configuration and the repository.
If you do not use a tool in many sessions, its startup initialization is a useful optimization candidate. If you use it immediately, lazy loading mainly shifts the wait.
Lazy Loading — Deferring Cost to Actual Usage
The lazy loading pattern registers a stub function under the binary name, which on first invocation initializes the full environment and replaces itself:
# ~/.bashrc — lazy nvm loader
# Initialization cost moves to first use

# Installation directory — without loading nvm.sh
export NVM_DIR="$HOME/.nvm"

# Stub functions for every nvm entry point
_lazy_load_nvm() {
    # Unset stubs to avoid recursion
    unset -f nvm node npm npx yarn pnpm 2>/dev/null

    # Actual initialization — cost paid only once, on demand
    [[ -s "$NVM_DIR/nvm.sh" ]] && source "$NVM_DIR/nvm.sh"
    [[ -s "$NVM_DIR/bash_completion" ]] && source "$NVM_DIR/bash_completion"
}

nvm()  { _lazy_load_nvm; nvm "$@"; }
node() { _lazy_load_nvm; node "$@"; }
npm()  { _lazy_load_nvm; npm "$@"; }
npx()  { _lazy_load_nvm; npx "$@"; }
yarn() { _lazy_load_nvm; yarn "$@"; }
pnpm() { _lazy_load_nvm; pnpm "$@"; }
Analogous pattern for pyenv:
This assumes pyenv is installed, with the optional pyenv-virtualenv plugin. Omit virtualenv-init if you do not use it. Check environment activation and completions: deferred initialization can change what is available before first use.
export PYENV_ROOT="$HOME/.pyenv"
export PATH="$PYENV_ROOT/bin:$PATH"

_lazy_load_pyenv() {
    unset -f pyenv python python3 pip pip3 2>/dev/null
    eval "$(pyenv init -)"
    eval "$(pyenv virtualenv-init -)" 2>/dev/null
}

pyenv()   { _lazy_load_pyenv; pyenv "$@"; }
python()  { _lazy_load_pyenv; python "$@"; }
python3() { _lazy_load_pyenv; python3 "$@"; }
pip()     { _lazy_load_pyenv; pip "$@"; }
pip3()    { _lazy_load_pyenv; pip3 "$@"; }
You pay the cost once, on first invocation — not on every tab open.
Completion Files — Preload Instead of Eval
The second time sink is generating completion files via eval "$(kubectl completion bash)". Every shell open spawns a kubectl process, parses its output, evaluates it in the current shell. A better pattern: cache on disk:
# Run after installing or updating kubectl:
mkdir -p "$HOME/.cache"
kubectl completion bash > "$HOME/.cache/kubectl-completion.bash.tmp" &&
  mv "$HOME/.cache/kubectl-completion.bash.tmp" "$HOME/.cache/kubectl-completion.bash"

# Keep only this in ~/.bashrc:
[[ -r "$HOME/.cache/kubectl-completion.bash" ]] &&
  source "$HOME/.cache/kubectl-completion.bash"
Regenerate after updating kubectl. Shell startup still reads and executes the saved script, but no longer runs kubectl to generate it.
PS1 — The Cost Paid on Every Enter
Startup optimization is one-time. PS1 optimization applies to every Enter keystroke. The classic problem:
# __git_ps1 must already be defined by your Git integration.
PS1='\u@\h:\w$(__git_ps1 " (%s)")\$ '
# The function runs on every prompt display.
Status checks can become noticeable in large repositories. Inspect what the prompt actually retrieves. Options include:
- Cache — keep state in the parent shell and define invalidation. PWD alone is insufficient: branches change without cd. Variables set in
$(...)do not propagate back to the parent. - Async prompt — requires transferring a background result and refreshing the prompt. Adding
&alone does not do this. - Static PS1 +
gsalias — remove git from PS1 entirely, addgs='git status -sb'. Brutal, but effective.
# Simple option: Git on demand
PS1='\u@\h:\w\$ '
alias gs='git status -sb'
Reorganization — What Belongs Where
| File | What goes there | What to avoid |
|---|---|---|
~/.bash_profile | Environment vars (PATH, EDITOR, LANG), source .bashrc | Aliases, functions, completions |
~/.bashrc | Aliases, functions, prompt, completions (cached), lazy loaders | Eager version-manager init, sync git in PS1 |
~/.bashrc.local | Machine-specific (work laptop, clusters), not committed to dotfiles | Portable configuration |
~/.inputrc | Readline history search and key bindings; read by programs using Readline | Everything else |
Moving expensive initialization from .bashrc to .bash_profile does not remove its cost. It changes which sessions pay it.
Comparing Before and After
Measure several runs for each configuration under the same conditions. Change one component at a time and keep individual timings, not only the mean. Check completions, environment activation and the first invocation of each tool as well as shell startup.
What Not to Do — Anti-patterns From Real Dotfiles
- Sourcing all of
.bashrcin scripts — move required functions to a separate file.shopt -s expand_aliasesenables alias expansion; it does not define aliases or load configuration. - Deferring every integration automatically — keep fzf shortcuts available if you need them from the first command. Measure the cost and assess your workflow.
- Aliases for
git,docker,kubectl— move to a static~/.bash_aliasesfile and source once. 50 aliases = 50aliasbuiltin calls — milliseconds in total, but discipline matters. - Ignoring first use — completion autoload can shift startup cost to the first Tab press. Measure both.
- Complex prompt — inspect spawned processes with strace. Run
strace -f -e trace=execve -o /tmp/prompt-exec.log bash --noprofile -i, display several prompts and exit. Separate shell startup from subsequent prompt refreshes in the trace.
Conclusion: The Shell as an Engineering Tool
Bashrc isn’t cosmetics. It’s a configuration file executed dozens, sometimes hundreds of times daily. Optimizing shell startup isn’t premature optimization — it’s amortizing cost across every interaction with the system.
A minimal-looking prompt can still run expensive commands. What matters is the work performed at startup and on each Enter. Remove unnecessary work where measurement shows a cost.
Measure before optimizing. Measure after. Decisions based on time, not based on what you read on r/unixporn.
The “measure first, optimize second” discipline that governs profiling shell startup is the same principle behind deciding when an epoll event loop stops being enough and when io_uring is over-engineering. Pinning down the bottleneck itself — whether in .bashrc or in production — is in turn the theme of the piece on debugging as a process of deduction.