You have a production bug. You look at the stack trace, open the indicated file and start poking around. Change one variable, deploy, wait. It did not help. Change another. Wait. Maybe this time.
This isn’t debugging. It’s gambling with production code.
A fix can work without you understanding why. At the next failure, you are back to guessing. Build a process that moves from observations to a verified cause.
Trial-and-error debugging is an illusion of control
Classic symptoms of bad debugging:
- You drop
console.logorprint()in random places throughout the code - You change several things at once, because “maybe one of them will fix it”
- You search Stack Overflow before fully understanding the error
- You restart the service without recording observations that distinguish restoring service from removing the cause
- You describe the problem as “something is broken” instead of a specific behavior
Every one of these habits has one thing in common: you’re acting without a hypothesis. Without a hypothesis you’re not debugging — you’re guessing.
How to Reason Through a Bug
You need observation and hypothesis testing. Exploration helps you learn the system; the problem begins when successive changes answer no specific question.
Exploration: examine data flow and the conditions under which the error appears. Gather evidence for a hypothesis.
Deduction means: “I know how the system should behave. I observe how it behaves. The gap between expectation and observation is my starting point.”
Before you touch any code, you need to answer three questions:
1. What is the exact, reproducible behavior of the system?
Not “something breaks on login.” Specifically: “A user whose email contains a + character can’t log in. The error only appears with OAuth, not password login. It reproduces on staging but not locally.”
The more precisely you describe the problem, the faster you’ll solve it. This isn’t pedantry — it’s basic debugging hygiene.
2. What is your expected behavior and how do you know?
You need a reference point. Do you have documentation? Tests? A previous commit where it worked? Without an answer to this question, you don’t even know what you’re looking for.
3. What’s your hypothesis?
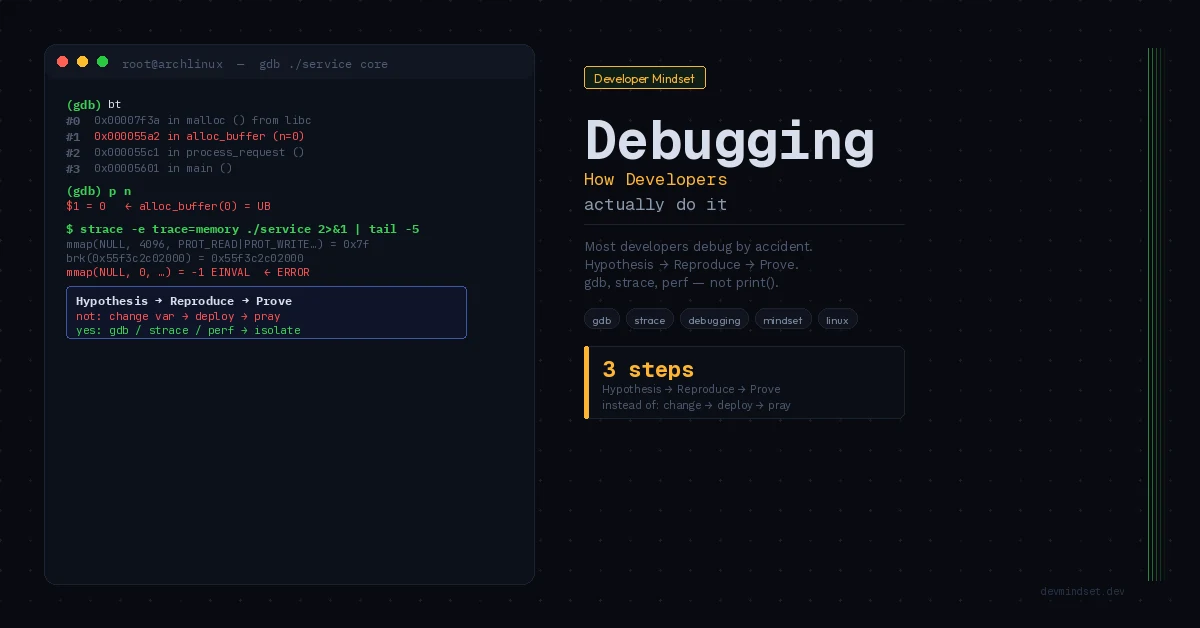
One specific hypothesis before you change anything. “I suspect the URL encoder in library X doesn’t handle the + character in the email parameter.” Then you verify that hypothesis — and only that one. If it turns out to be false, you form the next one.
Tools that shift the perspective
A debugger can help form a hypothesis as well as refute it. Before the next breakpoint, decide what you want to learn: are the data already wrong, which branch ran, who changed the value?
Binary search on code
If you can recognize correct state at points in the flow, inspect the middle. Are the data already wrong or still correct? Narrow the interval where they changed unexpectedly. This resembles binary search but provides no general O(log n) guarantee for debugging, especially with concurrency or timing-dependent failures.
Variable isolation
Every change in the environment is a potential cause. Before you start digging through code, ask: what changed since the last time it worked? New library version? Config change? Database migration? A commit from last week?
git bisect helps locate a regression between known good and bad versions. It needs a reliable classifier for intermediate versions. Flaky tests or failures that disappear and return independently of changes can undermine the result.
Logs as narrative, not noise
You read logs the way a detective reads witness statements — looking for inconsistencies, not confirmation of your theory. If you only log errors, you’re blind to what happens right before the error. A good log is context: who, what, when, with what input.
The mistake that costs hours: debugging the symptom instead of the cause
The stack trace points to line 203. That is a useful starting point, not yet evidence that the bug originated there.
Line 203 is where the system screams — not where the crime was committed. The logical error often appears 10, 20, 50 lines earlier, at the point where data enters the system in a bad state. Line 203 just happens to be the first place that can’t handle it.
Learn to read stack traces top-down, but think about them bottom-up. Where did the data enter the system? What should it have contained? What does it actually contain? Somewhere between input and symptom lies the cause.
When you’re stuck: the rubber duck technique
You’ve been on a problem for 45 minutes and have nothing. Don’t open Stack Overflow. Instead, explain the problem out loud — literally, in words — to anyone nearby. Or to a rubber duck on your desk. Or to a text file.
Explaining a problem step by step forces you to name assumptions you previously skipped. Sometimes the contradiction appears while you explain. Even without an immediate solution, you gain a concrete description for further investigation.
If you have no one to talk to, write. GitHub Issues, a Slack message to yourself, a notepad. Full problem description: what you see, what you expect, what you’ve already checked, what your current hypothesis is.
When a hypothesis concerns behavior outside application code — files, permissions or connections — use strace and syscall analysis. Choose the tool for the question you need to resolve.
What to do differently starting today
Next time you hit a bug, before you touch any code — write three sentences in a comment or text file:
- The exact, reproducible behavior you observe.
- The exact behavior you expect, and how you know.
- Your first hypothesis about the cause.
If answers are missing, return to observation. For a hard-to-reproduce failure, record what you still do not know and which data would let you check it.
This is the habit that separates engineers who “somehow fix things” from those who understand what they’re fixing and why — and that’s what debugging like a developer really means.
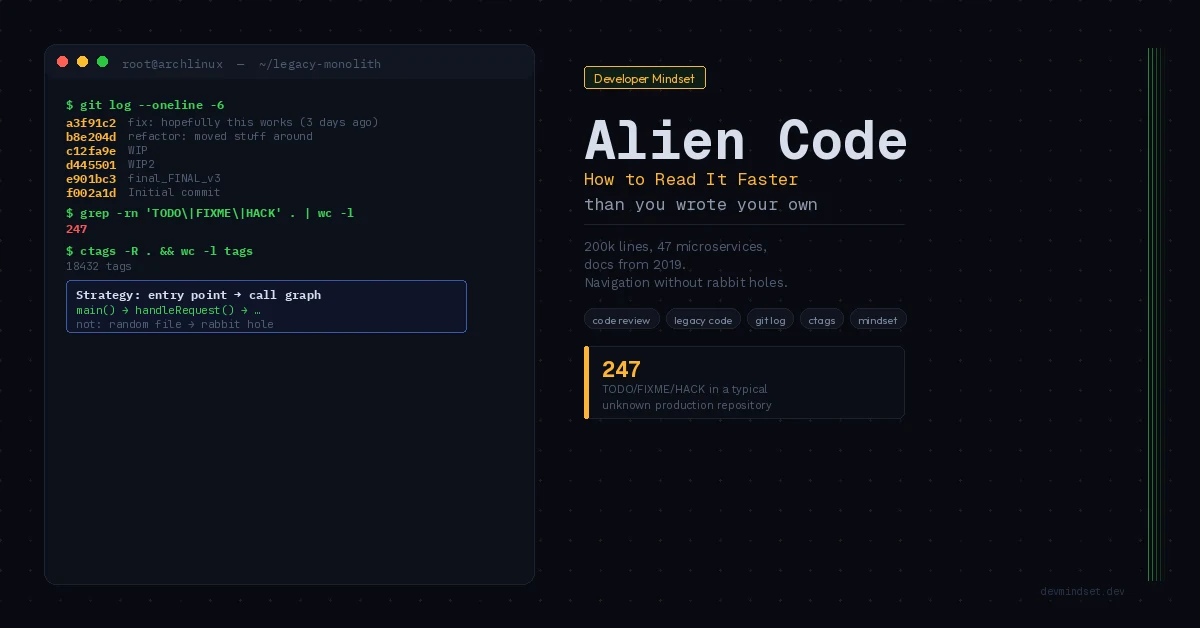
Methodically reaching the root cause has its most concrete case in memory-fault analysis — broken down in the piece on the anatomy of a segfault, from the MMU through the kernel to a gdb core dump. The deduction skill the whole process rests on, in turn, starts with understanding unfamiliar code from its entry points — because in both cases you build a model of the system before you touch it.