Your logs tell you what your code thinks it did. Your stack trace tells you where the code believed it was. strace tells you what the kernel actually did — every openat(), every read(), every connect() that returned -1 while your application swallowed the error and kept lying to you. When the gap between intent and reality is the bug, re-reading the source will not close it. You have to observe the boundary where userspace ends and the kernel begins.
Most engineers know strace -p <pid> as a panic button. Few actually read the output, and fewer reach for -f, -c, or -k when it counts. That gap is the difference between staring at a wall of syscalls and narrowing down a problem’s cause. Treating strace as a first-class instrument is a direct extension of hypothesis-driven debugging methodology: you form a precise claim about what the process is doing and let the evidence confirm or kill it.
What strace actually observes
strace uses ptrace(2) to stop a traced thread and read syscall information. These stops and transfers to the tracer have a workload-dependent cost. The ptrace, strace and gdb article explains the mechanism and permissions.
Reading a trace line — the part nobody teaches
Every line has the same shape: syscall(arguments) = return_value. The return value is where the truth lives. A successful call returns a file descriptor, a byte count, or 0; a failure returns -1 followed by the symbolic errno and its description. That errno is the signal you came for.
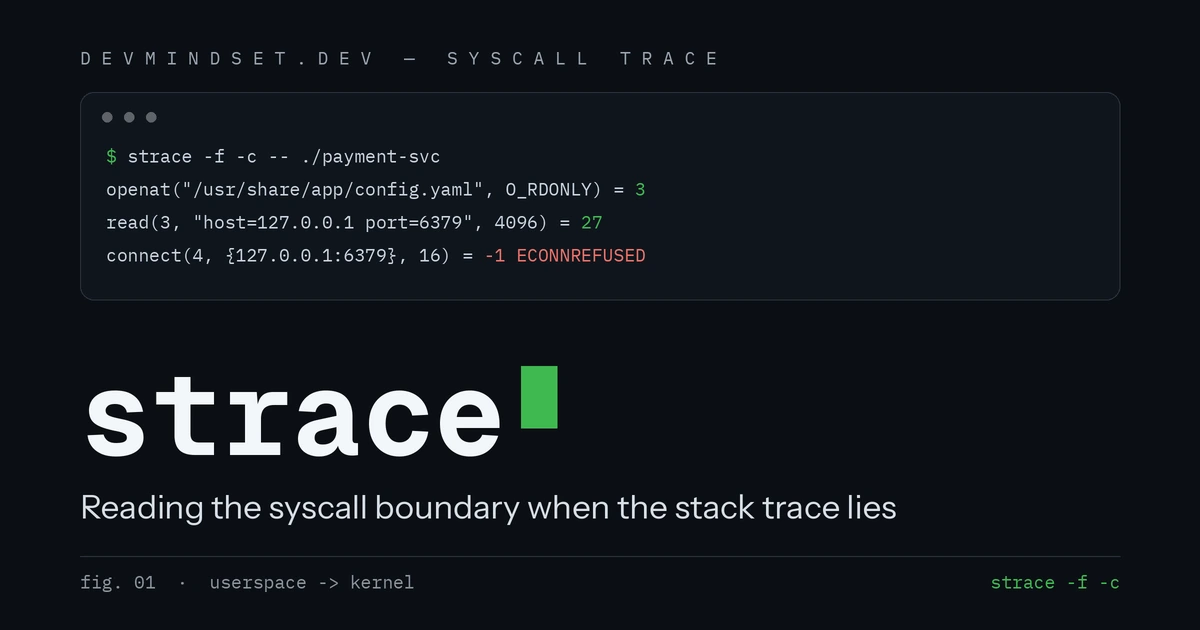
openat(AT_FDCWD, "/etc/app/config.yaml", O_RDONLY) = -1 ENOENT (No such file or directory)
openat(AT_FDCWD, "/usr/share/app/config.yaml", O_RDONLY) = 3
read(3, "host: 127.0.0.1\nport: 6379\n", 4096) = 27
connect(4, {sa_family=AF_INET, sin_port=htons(6379), sin_addr=inet_addr("127.0.0.1")}, 16) = -1 ECONNREFUSED (Connection refused)
EFAULT means the supplied memory range is not accessible for the requested read or write. It is not a memory-ownership test. A syscall can report an error where an invalid direct memory access by a process instruction may cause a SIGSEGV and core dump.
The flags that separate signal from noise
-f— follow forks and threads. The moment a process calls fork() or spawns a worker pool, an unadorned trace goes blind to the children. Almost every real service needs this flag.-e trace=…— filter by class instead of drowning.-e trace=network,-e trace=%file,-e trace=memorycut the stream to the syscalls you care about.-c— aggregate instead of stream. Produces a summary table of time, call count, and errors per syscall. This is your profiler the moment you suspect a process is syscall-bound.-T/-tt— time spent inside each syscall / absolute timestamps. Together they turn “it’s slow” into “it spends 600 ms infsync“.-y/-yy— decode descriptors, soread(3, …)becomesread(3</usr/share/app/config.yaml>, …)and sockets show their endpoints.-k— attach a userspace stack trace to each syscall, bridging “which syscall” to “which line of code”.-s N— raise the printed string length (the default truncates payloads).
By default, strace -c summarizes CPU time spent in the kernel, call counts and errors. For elapsed time inside syscalls, use -T or the -w -c summary mode. Low CPU time does not rule out long I/O waits. For shell startup, combine the trace with .bashrc timing.
From raw trace to an actionable summary
Reading -c output by eye is fine once. When you want it in CI, in a regression gate, or aggregated across runs, parse it. The wrapper below runs a command under strace -f -c, writes the summary to a separate file, parses it into typed records, and returns the syscalls that dominate time. It handles the obvious failure modes — strace missing, the target hanging, a malformed table — instead of assuming the happy path.
The -o file keeps application stderr out of the parser input; LC_ALL=C stabilizes number formatting. Python 3.10+ is required.
from __future__ import annotations

import os
import tempfile
import shutil
import subprocess
from dataclasses import dataclass
from typing import Final

_HEADER_TOKENS: Final[tuple[str, ...]] = ("seconds", "calls", "syscall")


@dataclass(frozen=True, slots=True)
class SyscallStat:
    name: str
    seconds: float
    calls: int
    errors: int

    @property
    def usec_per_call(self) -> float:
        return (self.seconds / self.calls) * 1_000_000 if self.calls else 0.0


class StraceError(RuntimeError):
    """Raised when strace cannot be run or its summary cannot be parsed."""


def profile_syscalls(cmd: list[str], *, timeout: float = 30.0) -> list[SyscallStat]:
    """Run *cmd* under ``strace -f -c`` and return per-syscall stats, busiest first.

    Raises:
        StraceError: strace is missing, the command times out, or the summary
            table cannot be located in the output file.
    """
    if not cmd:
        raise StraceError("empty command")
    if shutil.which("strace") is None:
        raise StraceError("strace is not installed or not on PATH")

    with tempfile.TemporaryDirectory(prefix="dm-strace-") as directory:
        summary = os.path.join(directory, "summary.txt")
        try:
            subprocess.run(
                ["strace", "-f", "-c", "-o", summary, "--", *cmd],
                env={**os.environ, "LC_ALL": "C"},
                timeout=timeout,
                check=False,
            )
        except subprocess.TimeoutExpired as exc:
            raise StraceError("tracing timed out") from exc
        except OSError as exc:
            raise StraceError("could not start strace") from exc
        with open(summary, encoding="utf-8") as stream:
            return _parse_summary(stream.read())


def _parse_summary(stderr: str) -> list[SyscallStat]:
    lines = stderr.splitlines()
    header = next(
        (i for i, ln in enumerate(lines) if all(t in ln for t in _HEADER_TOKENS)),
        None,
    )
    if header is None:
        raise StraceError("no summary table found; was -c passed to strace?")

    stats: list[SyscallStat] = []
    for line in lines[header + 1:]:
        if not line.strip() or line.lstrip().startswith("-"):
            continue
        if "total" in line:
            break  # the total row terminates the table
        cols = line.split()
        if len(cols) < 5:
            continue
        try:
            # cols: %time seconds usecs/call calls [errors] syscall
            seconds = float(cols[1])
            calls = int(cols[3])
            errors = int(cols[4]) if len(cols) >= 6 and cols[4].isdigit() else 0
        except (ValueError, IndexError):
            continue  # skip anything that is not a data row
        stats.append(SyscallStat(name=cols[-1], seconds=seconds, calls=calls, errors=errors))

    if not stats:
        raise StraceError("summary table present but no rows could be parsed")
    return sorted(stats, key=lambda s: s.seconds, reverse=True)


if __name__ == "__main__":
    import sys

    if len(sys.argv) < 2:
        raise SystemExit("usage: profile.py COMMAND [ARGS...]")

    for stat in profile_syscalls(sys.argv[1:]):
        marker = "  (has errors)" if stat.errors else ""
        name = stat.name.ljust(18)
        calls = str(stat.calls).rjust(8)
        print(f"{name}{stat.seconds:9.4f}s {calls} calls  {stat.usec_per_call:8.1f} us/call{marker}")
The wrapper detects a missing tool, timeout and missing table. It is a local experiment helper, not a ready-made CI gate: process-tree cleanup and data limits need an explicit policy. The parser was checked against a fixture; end-to-end tracing was not verified in the preparation environment. A Bash version with filters is in the examples repository; its slow mode requires GNU awk’s match(..., ..., array) extension.
strace vs ltrace vs gdb vs perf — pick the right lens
strace is one lens, not the only one. Each tool observes a different layer at a different cost, and reaching for the wrong one wastes time or perturbs the very behaviour you are chasing.
| Tool | Observes | Overhead | Best question | Operational considerations |
|---|---|---|---|---|
| strace | Syscalls (kernel boundary) | Can be high with frequent syscalls; depends on tracing mode | What is the process asking the kernel to do? | Bound the tracing interval and assess latency |
| ltrace | Library / function calls (userspace) | High | Which library calls fire, with what arguments? | Assess impact before attaching |
| gdb | Full program state, memory, breakpoints | Very high (stops the world) | What is the exact state at this line? | Live stops affect service; core analysis is offline |
| perf trace | Syscalls via perf_events | Low | How do syscalls behave under real load? | Measure probe and output overhead |
| bpftrace / eBPF | Arbitrary kernel + user probes | Very low | Custom, low-overhead production tracing | Measure probe and output overhead |
When not to reach for strace
Attaching may be denied by ptrace rules, Yama, capabilities, other LSMs or seccomp. The UID alone or the fact that a process runs in a container does not describe the full policy. Before attaching to a service, establish the measurement goal, scope and acceptable impact.
For anything that must run against production load, reach for perf trace or an eBPF tool such as bpftrace, which observe the same syscall boundary at a fraction of the cost. But on a box you control, with a process you can afford to slow down, strace remains the fastest way to answer the only question that matters when intent and reality diverge: what is this process actually doing? Once you can read its output fluently, that question stops being a mystery and becomes a lookup.
Technical reference: strace(1).