What Exactly Happens When a Process Touches a Bad Address
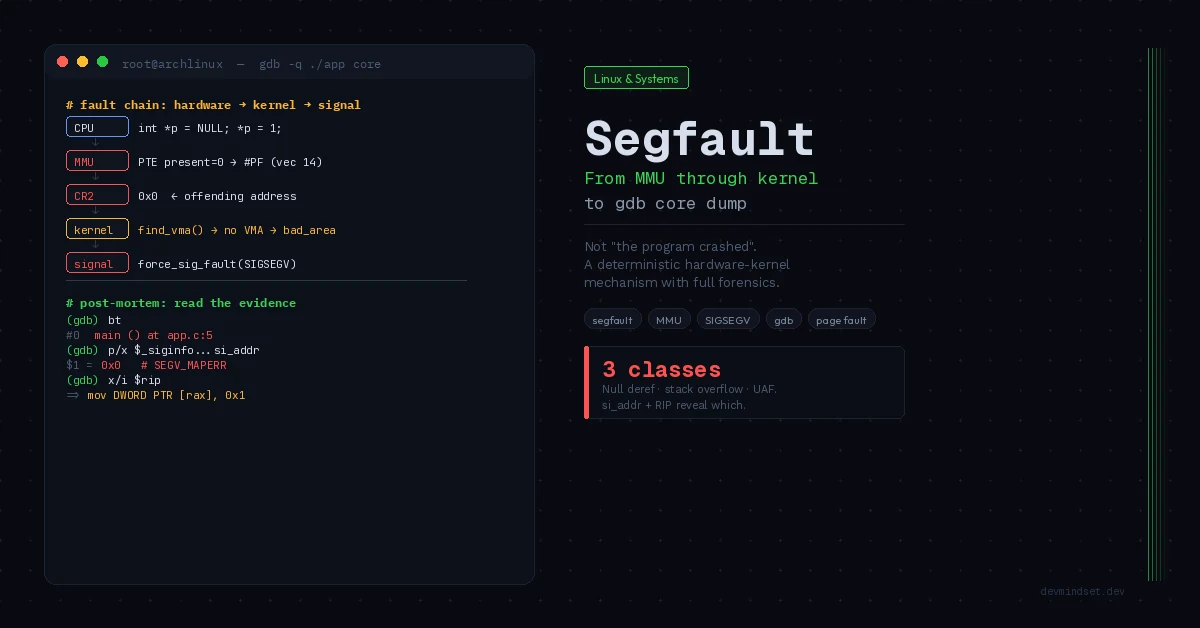
A segfault (segmentation fault) isn’t “the program crashed.” It’s a precise, deterministic memory protection mechanism: the MMU (Memory Management Unit) detects access to a memory page that violates its permissions, generates a hardware exception, the kernel handles it in the page fault handler, and — when it can’t be legalized — delivers a SIGSEGV signal to the offending process.
Segmentation fault tells you where the system detected an invalid access. It need not identify where the original bug occurred. The core dump, instruction and accessed address help distinguish the immediate failure from earlier memory corruption.
This article dissects the anatomy of a segfault from the hardware level (MMU, page table) through the kernel (do_page_fault, signal delivery) to practical post-mortem analysis in gdb. Without this knowledge, debugging memory errors is guesswork.
The Hardware Layer: MMU and Address Translation
Every address your program touches is a virtual address. The processor never addresses physical memory directly — between the instruction and RAM sits the MMU, which translates virtual to physical addresses through a multi-level page table structure.
A common x86-64 model uses four page-table levels: PML4 → PDPT → PD → PT. Hardware and the kernel may also support five levels. This article uses the simplified four-level model; entries contain addresses of further tables or frames and permission bits.
- Present (P) — whether the page is in physical memory
- Read/Write (R/W) — whether writing is allowed
- User/Supervisor (U/S) — whether userspace may touch this page
- Execute-Disable (NX) — whether the page contains executable code
When a CPU instruction attempts an access violating these bits — address not mapped (P=0), write to read-only (R/W=0), executing an NX=1 page — the MMU generates a page fault: hardware exception #PF (vector 14), which transfers control to the kernel along with an error code and the offending address in the CR2 register. These same page permission bits are set when the program’s segments are loaded — exactly how is covered in the article on ELF and dynamic linking.
Key Distinction: Page Fault ≠ Segfault
A page fault does not automatically mean a segfault. It can trigger ordinary memory management: attaching a page, reading data or copy-on-write.
| Page fault type | What happens | Segfault? |
|---|---|---|
| Minor fault | Page in memory, no PT mapping (e.g. shared library) | ❌ Kernel maps, resumes |
| Major fault | Handling requires I/O, such as reading a file or swap | ❌ Kernel loads from disk |
| Demand paging | First access to allocated but untouched page | ❌ Kernel allocates physical frame |
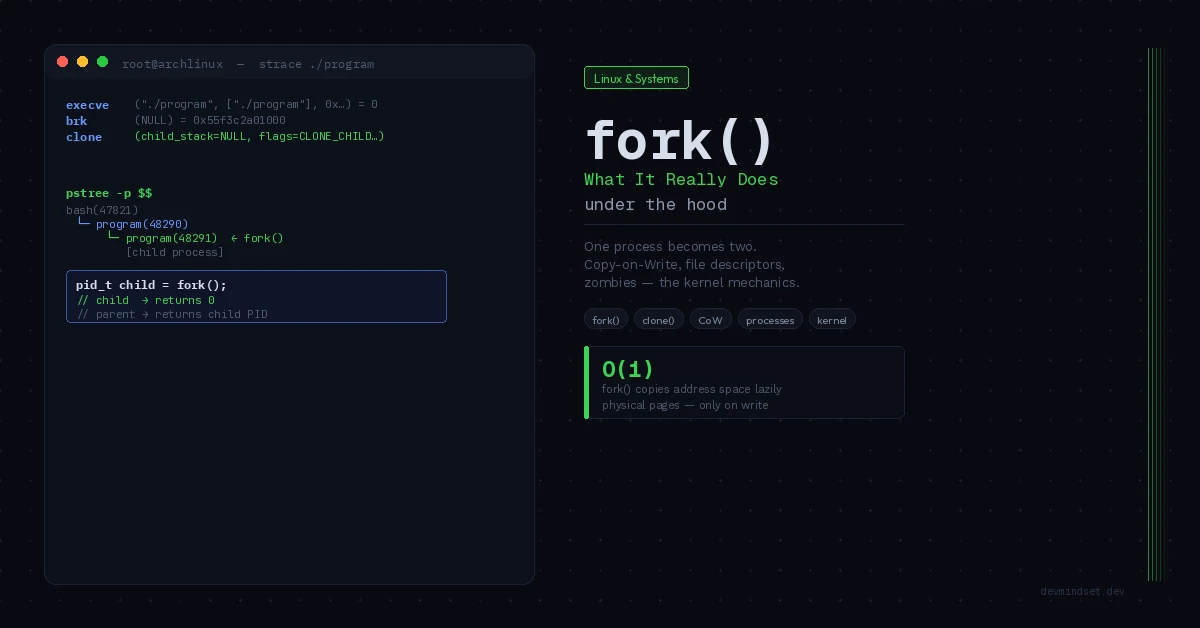
| Copy-on-Write | Write to a shared page after fork() | ❌ Kernel copies the page |
| Invalid access | Address outside the process’s legal vma | ✅ SIGSEGV |
Only when the kernel determines the address cannot be legalized — it belongs to no Virtual Memory Area (VMA) of the process or violates VMA permissions — does it escalate to SIGSEGV.
The Kernel Layer: The Path from #PF to SIGSEGV
On Linux x86-64, handling begins in do_page_fault() (today handle_page_fault() in arch/x86/mm/fault.c). A simplified decision path:
/* Pseudocode of the kernel page fault handler path */
void handle_page_fault(struct pt_regs *regs, unsigned long error_code) {
    unsigned long address = read_cr2();  /* offending address */
    struct vm_area_struct *vma;

    /* Find the VMA containing this address */
    vma = find_vma(current->mm, address);

    if (!vma) {
        /* Address outside any legal mapping */
        goto bad_area;  /* → SIGSEGV */
    }

    if (address < vma->vm_start) {
        /* Could this be a legal stack growth? */
        if (!(vma->vm_flags & VM_GROWSDOWN))
            goto bad_area;  /* → SIGSEGV (e.g. stack overflow) */
        expand_stack(vma, address);
    }

    /* Check permissions: write to read-only? execute NX? */
    if ((error_code & PF_WRITE) && !(vma->vm_flags & VM_WRITE))
        goto bad_area;  /* → SIGSEGV (write to .rodata) */

    /* Legal fault — map the page, resume execution */
    handle_mm_fault(vma, address, flags);
    return;

bad_area:
    /* Deliver SIGSEGV to the process */
    force_sig_fault(SIGSEGV, si_code, (void __user *)address);
}
The SIGSEGV signal carries a siginfo_t structure with a si_code field distinguishing why the segfault occurred:
SEGV_MAPERR— address not mapped at all (classic null deref, wild pointer)SEGV_ACCERR— address mapped, but no permission (write to read-only, execute NX)SEGV_BNDERR— bounds violation (Intel MPX)SEGV_PKUERR— protection key violation (PKU)
Taxonomy: Three Classes of Segfaults
Three common sources are null pointer dereferences, exhausted stacks and object-lifetime errors. The list is not exhaustive: invalid indexes, mapping permissions and corrupted pointers can also cause crashes.
1. Null Pointer Dereference
Address zero is normally unmapped, and mmap_min_addr is one constraint on low-address mappings. Dereferencing NULL in C is undefined behavior, however, not a promise of a particular signal or optimized instruction.
#include <stdio.h>

int main(void) {
    int *ptr = NULL;
    return *ptr;  /* SIGSEGV, si_code = SEGV_MAPERR, CR2 = 0x0 */
}
$ gcc -g segfault_null.c -o segfault_null
$ ./segfault_null
Segmentation fault (core dumped)
$ gdb -q ./segfault_null core
(gdb) bt
#0 0x0000555555555129 in main () at segfault_null.c:5
(gdb) print ptr
$1 = (int *) 0x0
(gdb) p/x $_siginfo._sifields._sigfault.si_addr
$2 = 0x0 # CR2 — access to the zero address2. Stack Overflow
Infinite (or excessively deep) recursion grows the stack past its limit (RLIMIT_STACK, check your limit with ulimit -s). When the stack tries to enter the guard page just below the VMA’s lower bound — the kernel sees access outside the legal region and cannot handle it as stack growth.
#include <stdio.h>

/* Recursion with no base case — stack growth with each recursive call */
long recurse(long depth) {
    char frame_buffer[4096];  /* 4 KB per frame — exhausts stack faster */
    frame_buffer[0] = (char)depth;
    return recurse(depth + 1) + frame_buffer[0];
}

int main(void) {
    return (int)recurse(0);  /* behavior depends on stack limit and optimization */
}
$ gdb -q ./stack_overflow core
(gdb) bt
#0 recurse (depth=2046) at stack_overflow.c:6
#1 recurse (depth=2045) at stack_overflow.c:7
#2 recurse (depth=2044) at stack_overflow.c:7
... (thousands of identical frames — the stack overflow signature)
(gdb) p $sp
$1 = (void *) 0x7ffffffde000 # stack pointer at the guard page boundary
(gdb) info proc mappings
# $sp coincides with the lower bound of the [stack] VMADiagnostic signature: thousands of identical frames in the backtrace + $sp exactly at the lower bound of the [stack] mapping.
3. Use-After-Free / Heap Corruption
The most insidious class, because it doesn’t always crash deterministically. Access to freed memory may work fine until the allocator returns the page to the kernel (via munmap) — only then does the address become unmapped, and only then does the segfault occur, far from the actual bug.
#include <stdlib.h>
#include <string.h>

typedef struct {
    char name[64];
    void (*callback)(void);  /* function pointer — attack vector */
} Session;

static void callback(void) { /* valid target before free() */ }

int main(void) {
    Session *s = malloc(sizeof(Session));
    if (!s) return 1;
    s->callback = callback;
    strcpy(s->name, "session-1");
    free(s);                  /* memory freed */

    /* Use-after-free: callback points to garbage after arena reuse */
    s->callback();            /* undefined behavior; no signal is guaranteed */
    return 0;
}
gdb can help, but instrumentation often reveals an invalid access closer to its source. The following example deliberately contains a use-after-free; run it as a separate test program.
# AddressSanitizer — detects use-after-free at the access, not the crash
$ gcc -g -fsanitize=address use_after_free.c -o uaf
$ ./uaf
==12847==ERROR: AddressSanitizer: heap-use-after-free on address 0x...
    #0 0x... in main use_after_free.c:16
freed by thread T0 here:
    #1 0x... in free
    #2 0x... in main use_after_free.c:13   # exact free()
previously allocated by thread T0 here:
    #3 0x... in malloc
    #4 0x... in main use_after_free.c:11    # exact malloc()
ASan provides three stack traces: where the bad access occurred, where the memory was freed, where it was allocated. That turns hours of guessing into three seconds of reading.
Practice: Configuring Core Dumps
Before you can debug anything post-mortem, the system must actually write a core dump. By default on many distributions this is disabled (ulimit -c 0):
core_pattern is system-wide. Change it only in a controlled environment. ulimit alone does not guarantee a core file: the dump-handler configuration matters too.
# Enable unlimited core dumps for the current session
$ ulimit -c unlimited

# Where systemd writes core dumps (most modern distros)
$ cat /proc/sys/kernel/core_pattern
|/usr/lib/systemd/systemd-coredump %P %u %g %s %t %c %h

# List captured core dumps
$ coredumpctl list

# Open the latest crash directly in gdb
$ coredumpctl gdb

# File pattern instead of systemd-coredump (for containers/CI)
$ echo "/tmp/core.%e.%p" | sudo tee /proc/sys/kernel/core_pattern
Methodology for Reading a Backtrace
Opening a core dump is just the start. Systematic analysis:
| gdb command | What it reveals |
|---|---|
bt full | Backtrace with each frame’s local variables |
frame N | Jump to a specific stack frame |
info registers | Register state at crash (RIP = faulting instruction) |
x/i $rip | Disassembles the instruction that caused the segfault |
p/x $_siginfo | si_code and si_addr — why and at what address |
info proc mappings | VMA map — is the address in stack, heap, or nowhere |
p variable | Pointer value — usually 0x0 or obvious garbage |
Start with the instruction, accessed address and si_code. Then check the mapping and object lifetime. This follows the same hypothesis-driven debugging method. An address alone may not reveal the original bug.
Tools: When gdb Isn’t Enough
| Tool | Detects | Overhead |
|---|---|---|
| gdb + core | Post-mortem: where it crashed | Zero (after the fact) |
| AddressSanitizer | UAF, heap/stack overflow, use-after-return | Depends on program and settings |
| Valgrind (memcheck) | UAF, leaks, uninitialized reads | Substantial; measure it |
| MemorySanitizer | Reads of uninitialized memory | Workload-dependent |
| Valgrind + vgdb | UAF with interactive gdb at the error | Substantial; interactive stops add impact |
Practical rule: ASan in CI and development (fast, catches most), Valgrind for hard cases (slow but deeper), gdb + core for production (the only thing you have after the fact).
Conclusion: The Segfault as a Diagnostic Signal
A segfault isn’t a random failure — it’s a deterministic hardware-kernel mechanism carrying precise information: the exact address (CR2/si_addr), the instruction (RIP), the reason (si_code), and full execution context (the core dump). An engineer who treats this information as forensic evidence — not as a message to ignore — debugs memory errors in minutes instead of hours.
The described path — an x86 access fault, kernel handling and SIGSEGV — is common, not universal. Software can generate SIGSEGV too, and some mapped-file faults cause SIGBUS, covered in the mmap article.
Memory in C/C++ doesn’t forgive. But the operating system gives you exactly as much information as you need — provided you know how to read it.
Related articles
- What fork() in Linux Really Does Under the Hood — Copy-on-Write and page faults in practice
- malloc internals — Why free() Doesn’t Return Memory to the System — use-after-free and chunk corruption from the allocator’s side
- ELF and Dynamic Linking — What Happens Before main() Runs — segment mapping and page permissions
- Why Most Developers Debug Wrong — Debugging Like a Developer — gdb/strace/perf methodology
Technical references: x86 five-level paging, AddressSanitizer.